Best Time to Post on LinkedIn in 2026
Every big 2026 study agrees midweek beats the rest of the week on LinkedIn. They disagree completely about the best hour, and that disagreement tells you more than any single recommended time slot.
Updated
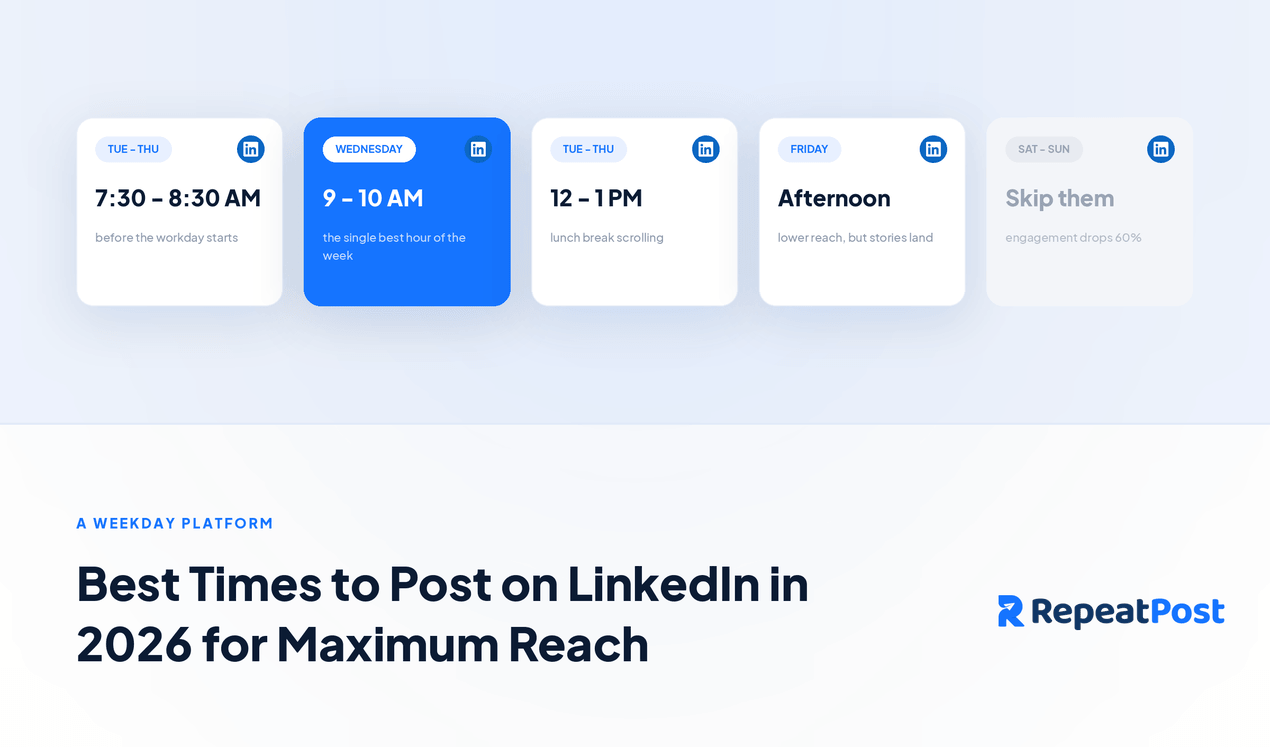
Post on LinkedIn Tuesday, Wednesday or Thursday. Every major 2026 study agrees on that, and all of them agree weekends are the worst time to post. The best hour is where it falls apart: Buffer analysed 4.8 million posts and landed on 3 p.m. to 8 p.m., while Metricool analysed 673,658 posts and landed on 9 a.m. to 12 p.m. Those windows do not overlap at all.
That contradiction is the most useful thing in this article, so we are going to sit with it rather than pretend it away.
What every study agrees on
Four publishers ran timing studies on LinkedIn in late 2025 and 2026. Here is where they line up.
Midweek wins. Wednesday appears in the top set for all four. Tuesday appears in all four as well.
- Sprout Social found Tuesday, Wednesday and Thursday offer "the most consistent and prolonged periods of peak engagement" (Sprout Social, 2026)
- Buffer named Wednesday the single best day, followed by Thursday, then Friday (Buffer, 2026)
- SocialPilot found "Tuesday, Wednesday, and Thursday showed the best level of engagement" (SocialPilot, 2025)
- Metricool named Monday, Tuesday and Wednesday (Metricool, 2026)
Weekends lose. Sprout Social, SocialPilot and Metricool all name Saturday and Sunday the worst days. Sprout Social's reasoning is the obvious one: LinkedIn is a professional network, and people are not at work.
You will see a claim floating around that LinkedIn engagement drops 60% at weekends. We went looking for the source and could not find one in any of these four studies. Treat the direction as real and the number as unverified.
Where the studies fall apart
Now the hour. Four samples, four answers.
|
Study |
Sample |
Best window |
Timezone basis |
|---|---|---|---|
|
Buffer (2026) |
4.8M LinkedIn posts |
3 p.m. to 8 p.m., peaking Wednesday 4 p.m. |
Normalised to audience local time |
|
Metricool (2026) |
673,658 posts, 63,108 accounts |
9 a.m. to 12 p.m. |
Time zones grouped for a global view |
|
Sprout Social (2026) |
Pooled across six platforms |
11 a.m. to 5 p.m. |
Audience local time |
|
SocialPilot (2025) |
683,000 posts, 47,672 accounts |
10 a.m. to 5 p.m. |
EST |
Buffer and Metricool are describing different halves of the working day. Sprout Social and SocialPilot sit in the middle and overlap both.
Buffer is refreshingly honest about this. The company flagged the late day pattern as a change from its own previous year and then declined to explain it: "Our data can't tell us why the change is happening, though, only that later posting times performed particularly well."
Why four large studies can disagree
Three reasons, and all of them are visible in the published methodologies.
They are all sampling their own customers. Buffer measured posts sent through Buffer. Metricool measured Metricool accounts. SocialPilot measured accounts connected to SocialPilot. None of these is a sample of LinkedIn. They are samples of scheduled, marketer produced business content, which by construction skews toward office hours and away from spontaneous posting.
They are not all measuring the same thing. Some of these studies measure engagement rate per post. Others measure when the most users are online. Those two questions have different answers, and mixing them produces contradictions that are not really contradictions.
They do not share a clock. Sprout Social and Buffer normalise to the audience's local time. SocialPilot reports EST. Metricool groups time zones into a global aggregate. Comparing their recommended hours without adjusting for that is meaningless.
There is a fourth reason, and it is the important one. If posting hour were a strong, stable effect, three large studies of the same platform published within months of each other would not produce non overlapping answers. The spread is the finding.
What the one piece of independent research says
Almost everything written about posting times comes from companies selling scheduling software. There is one exception worth knowing about.
Researchers at the University of Jyväskylä published the only formal causal analysis of posting time we could find, in Statistical Methods and Applications in 2023. They used Bayesian modelling on 790 posts from a large consumer cooperative, and reached three conclusions that should shape how you read every table in this article.
The best posting slot changed depending on the type of content, within a single account. Their uncertainty ranges spanned roughly a factor of four. And they warned specifically against the ranked hour tables that scheduling vendors publish, on the grounds that estimates for adjacent hours are correlated, so comparing them precisely can mislead.
That is a small study on one organisation's Facebook page, and it does not transfer cleanly to LinkedIn. It is still the most rigorous work on the question, and it points the same way as the vendor disagreement: the effect is real but small, unstable, and specific to you.
What matters more than the hour
Buffer put this better than we could, after analysing more than 52 million posts:
the biggest gap in this data isn't between "good timing" and "bad timing." It's between posting and not posting.
And, in the same report: "what you post matters most, how often you post matters a lot, and when you post matters least."
LinkedIn itself agrees. In its own guidance on posting times, LinkedIn concluded that "the timing is often less important than the substance." That guidance dates from 2024 and LinkedIn has not refreshed it since.
One thing nobody mentions: LinkedIn publishes no first party timing data at all. Every number in this article, and in every other article you will read on this subject, comes from a third party scheduling tool measuring its own customers.
Format is a far bigger lever than hour. Buffer's 2026 analysis of 52 million posts found LinkedIn carousels reached a median engagement rate of 21.77%, against 7.35% for video, 6.52% for images, 3.81% for links and 3.18% for plain text. Socialinsider, measuring 1.3 million posts across 16,645 business pages, found native document posts on top at 7.00% against 4.50% for text.
The two studies disagree on absolute numbers because they use different denominators on different account populations. They agree completely on the ranking: document and carousel formats beat everything else, and link posts sit near the bottom.
Replying is a bigger lever still. Buffer found that replying to comments was associated with 30% higher engagement, and that 83% of profiles performed better when they replied.
Who posts matters as much as when
Metricool's 2026 study surfaced a gap that dwarfs any hour of the day: personal profiles saw a 63% higher engagement rate than company pages.
If you run a brand on LinkedIn and your posts go out only from the company page, the account type is costing you more reach than a badly chosen posting slot ever will. The fix is not to abandon the company page. It is to have real people post as themselves and let the brand amplify them.
Metricool found one more thing worth acting on immediately: posts that include a direct question earned 77.39% more comments. Given that comments are the early engagement signal LinkedIn's ranking watches for, that is a lever you can pull on your very next post.
The wider trend in the same study is mixed. Metricool measured LinkedIn engagement up almost 14% year on year, but the components moved in different directions: likes fell 13%, comments fell 17% and shares fell 10%, while clicks rose 5%. People are reacting less and clicking through more. If your reporting leans on likes as a health metric, that decline may be the platform shifting rather than your content failing.
Why timing has any effect at all
There is a real mechanism, and it is worth understanding so you can judge how much to care.
LinkedIn's feed is not chronological. It sorts by "Top Updates" by default, and chronological order is a manual toggle most people never touch. In March 2026 LinkedIn announced it now uses large language models and what it calls "Generative Recommenders" to understand what a post is actually about, while showing less of what it describes as repetitive, low substance posts and engagement bait.
Under that kind of ranking, early engagement is a signal. Sprout Social's stated reasoning: "Because LinkedIn's algorithm prioritizes early engagement to determine a post's reach, posting when your audience is scrolling ... increases initial interactions and overall visibility."
So the hour is not irrelevant. It is a small multiplier on a post that already has to earn attention. Metricool found that 50% of a LinkedIn post's total impressions arrive within the first 48 hours, which tells you the window is measured in days, not minutes.
How to find your own best time
Global averages are a starting point. Every one of the four publishers says so in its own article. Sprout Social calls your own audience data "king." SocialPilot is blunter: "it is rather more suitable to test and find your own data than to stick to a fixed template of best times."
Here is a method that takes about three weeks.
- Start from midweek. That is the one finding four independent samples agree on. Tuesday to Thursday.
- Pick two windows, not one. Take a morning slot and a late afternoon slot, because that is precisely where the studies disagree and where your audience may differ from the average.
- Hold everything else steady. Same format, same topic type, same frequency. If you change the format at the same time you change the hour, you learn nothing, because format has the larger effect.
- Give it three weeks. Metricool's finding that half of impressions land inside 48 hours means a single post tells you very little. You need enough posts to see a pattern.
- Read your own analytics, not the averages. Check when your followers are actually active and which posts earned early comments.
Once you know your windows, stop thinking about them. Set recurring slots and fill a queue. Our guide to social media scheduling covers the batching workflow, and RepeatPost's publishing tools let you save a weekly slot pattern per channel so you are dropping content into a schedule rather than picking a time every morning.
The honest summary
Post midweek. Avoid weekends. Pick a slot your own analytics support rather than one you read in an article, this one included.
Then spend the time you would have spent optimising your posting hour on the things with larger measured effects: publishing a document or carousel instead of a link, replying to every comment, and posting consistently enough for any of it to matter.
If you are applying this across several platforms at once, timing gets harder to manage by hand. Our multi channel strategy guide covers how to keep a schedule sustainable across channels, and you can compare platform patterns in our companion pieces on Instagram and X. RepeatPost connects to 16+ channels from one calendar, with analytics that show you your own posting windows instead of somebody else's averages.